
Are We Spending More or Less on Kids?
It’s stated frequently, the statistical factoid (statoid? statisticoid? hmmm.) that per-pupil spending in Brookline Schools has fallen during the enrollment boom, i.e. between 2006 and now. We’ve added kids, so of course, we are spending less on each kid. We’ve cut to the bone. We’re already underfunding our schools. Only the maximum extent possible override (MEPO) will retain your property value or keep our schools excellent.
And looking at the data, yes, we’re spending less. But on what?
- Less on interest payments for building the New Lincoln School in 1990 (Brookline’s first override ever after prop 2 1/2) and renovating the High School in 1995 (Brookline’s second override ever).
- Less on health care because Brookline joined the GIC, saving us a bunch.
- Less on out-of-district special education placements by providing equivalent services at less cost in-district.
But not less on School Budgets or teachers or kids. The Brookline School Budgets keeps going up. In fact, we’ll see that from 2006 to 2014:
- Enrollment in Brookline Public Schools went up 21% from 6014 to 7288 kids;
- The Brookline School Budget increased 41.7%, from $60M to $85M;
- The Brookline School Budget increased 4.48% per year on average.
- Per-pupil the School Budget is doing just fine, too, thank you very much, having increased 17%, from $10,046 to $11,751;
- Yes, even inflation-adjusted per-pupil spending is just around 0% (-0.67%) over the last 8 years.
I guess we do love our kids here in Brookline.
Let’s dig into the data.
Types of Spending
What kind of spending are folks talking about when they say we are spending less?
Per-pupil average spending including the CIP
Hmm…that sounds a little wonk-ish. Per-pupil means you’re going to do an average anyways. Let’s mention that averages are often misleading, especially when there is a skew in the distribution, i.e. the level of spending on the special needs population skews the average “per-pupil spending” quite a bit. But let’s stay with it.
Why do folks point to that? The argument is easy – each new child in school means our fixed dollars are spread thinner per pupil. It is also trying to build a subtle connection between spending and “spending on kids”. That is an important distinction which we’ll tease apart below.
And what about the “including the CIP” bit. Recall the CIP is the Town’s “Capital Improvement Plan”. The Town pays interest when it borrows money to build buildings, including School buildings. But there are a good number of other costs the Town pays on behalf of Schools beyond just the CIP. They are all factored into that “including CIP” bit.
So overall that is an …. interesting but hard to understand metric.
Who says Per-Pupil Spending is Down
First written history of it seems to be from the Override Study Committee’s Schools Program Task Force, which had the executive summary item:
Average per pupil inflation-adjusted spending (including CIP) has in fact declined since the 2008 override. Spending was $17.4k per student in FY06, $17.9k per student in FY09 (increased following the override), and $16.9k per student in FY14.
And that position justifies the minority position for a large override – we’re falling behind in how much we spend on our schools.
That leaves out a bit of important nuance. Let’s look at the data at the Massachusetts Department of Education and the Brookline School Departments Budget.
Department of Education Data
Before we go to the source, let’s get familiar with the Mass Dept. of Ed report for Brookline on spending for 2010 / 2011, the year when folks say things really went down hill for our spending.
| Function | 2010 | 2011 | ||
| Total Exp | Per Pupil | Total Exp | Per Pupil | |
| Administration | $4,740,885 | $725 | $5,012,395 | $750 |
| Instructional Leadership | $7,077,144 | $1,082 | $7,626,542 | $1,141 |
| Classroom and Specialist Teachers | $41,626,534 | $6,362 | $42,039,477 | $6,292 |
| Other Teaching Services | $10,936,364 | $1,672 | $11,249,982 | $1,684 |
| Professional Development | $1,617,351 | $247 | $1,909,144 | $286 |
| Instructional Materials, Equipment and Technology | $2,498,293 | $382 | $3,179,712 | $476 |
| Guidance, Counseling and Testing | $3,668,930 | $561 | $3,642,439 | $545 |
| Pupil Services | $4,799,039 | $733 | $5,249,669 | $786 |
| Operations and Maintenance | $9,467,236 | $1,447 | $9,655,472 | $1,445 |
| Insurance, Retirement Programs and Other | $18,410,963 | $2,814 | $16,489,499 | $2,468 |
| Payments To Out-Of-District Schools | $8,138,531 | $119,509 | $5,952,865 | $70,952 |
| TOTAL EXPENDITURES | $112,981,270 | $17,090 | $112,007,196 | $16,556 |
Which which items did we spend less money on between 2010 and 2011. The things I colored red in the table above:
- Insurance/Retirements – almost $2M dollars. Good results from Brookline joining the state’s GIC insurance pool.
- Special Education (SPED) Payments to Out-of-District Schools – slightly more than $2M. This amount is highly variable from year to year based on the kids in the system. The per-pupil costs on those out-of-district placements went from $110,000 to $71,000, with the state average for that per-pupil out-of-district cost being… $20,000. At least we’re on par with Newton in this metric.
What things did Brookline Schools spend more money on? Well, almost everything else.
Public School of Brookline Budgets
There are some good nuggets in the budgets that the Public Schools of Brookline publish.
[Aside: It seems that the PSB does not go back and publish “final” budgets, just leaving the previous “preliminary” available.]
Let’s look at pages 317, 319, and 322 of the Superintendent’s Preliminary 2014 Budget (beware 24MB pdf) to get some data on spending from the Schools and the Towns contribution.
Here are screen shots of the PDFs of those pages, starting with page 322, which is all about…per-pupil spending! Yeah, we found the source.

So the Per-Pupil Spending, using the somewhat complicated methodology described therein, does show a dip from 2010 to 2011 from $17,090 to $16,556. It does mention it includes costs carried by the Town of Brookline spent in support of schools.
Let’s look at page 316 of that document showing net school spending, which shows a high level break out of the “School Department Budget” and “Town Spending on Behalf of Schools”:

As the School Budget points out, the Town contributes to the Schools by paying for things like: school administration, utilities like oil & natural gas for the schools, maintenance of school grounds and buildings, insurance for retired and active employees, pension benefits for employees, principal and interest on loans for school building projects.
We find a detailed breakout of what categories the Town spends money on behalf of the Schools on Page 319.

The Data
Let’s pull out some of that data from those various sources. And let’s also join that with yearly student enrollment data from the DOE so we can get at per-pupil values for those spends. And for good measure, let’s do some inflation adjustments using the Bureau of Labor Statistics. The full table of data used to make these graphs is available at the bottom of this article.
Student enrollment over time and the yearly growth. Yes, it is definitely positive over time.

Brookline Public School Enrollment over time
Here is the Public School of Brookline Budget per year, not including what the Town pays. The line in the graph shows the year-over-year change. Note the jump in 2009, which came from the 2008 passed in to add Elementary World Language and lengthening the school day by 20 minutes.
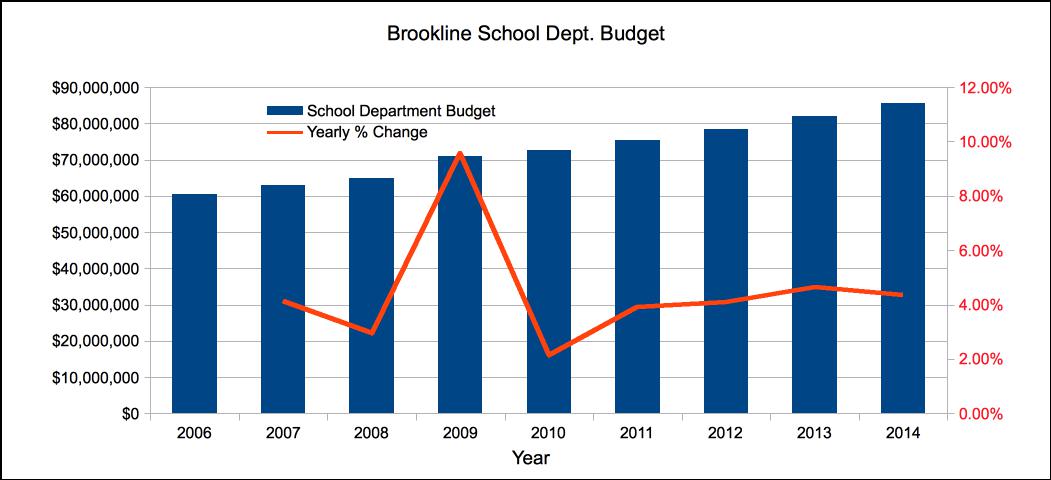
Absolute Brookline Public School Budget.
What has happened to the Town contribution over time?
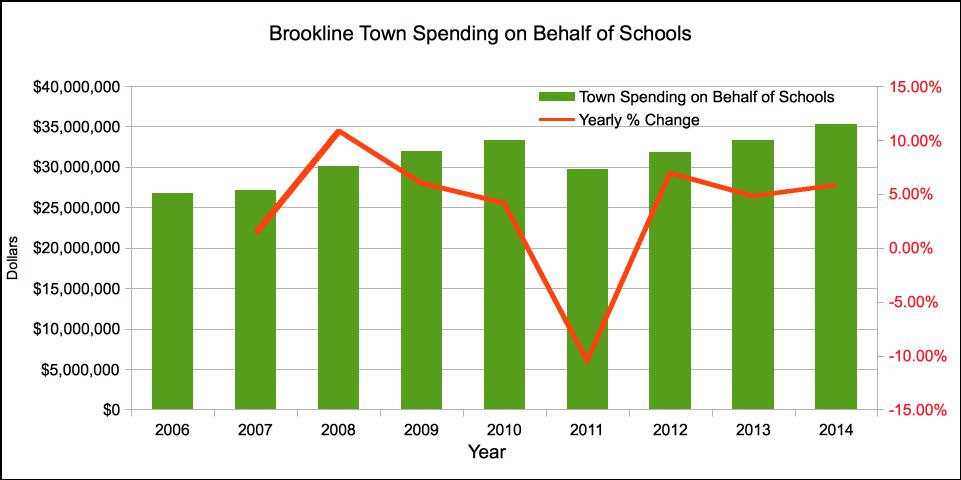
Absolute dollars Town Contribution to Brookline Schools
Now let’s look at both those values on a per-pupil basis, starting with the School Budget. The School Budget per-pupil growth is positive year-over-year. That means the Schools are spending at least the same per-pupil over time.
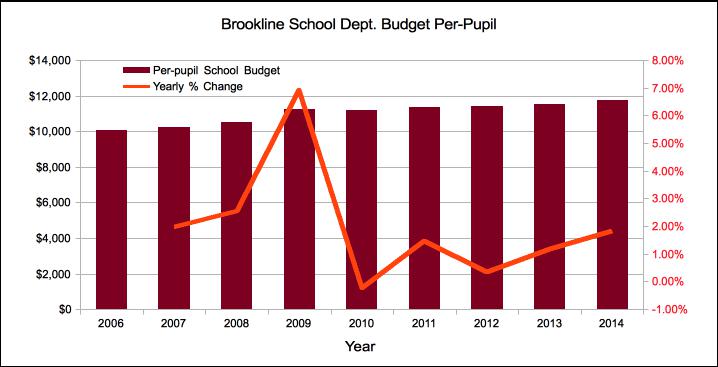
Brookline School Dept. Budget Per-Pupil
Now let’s look at the Town share of spending on schools per-pupil. Almost neutral except for a big drop in 2011, the year we stopped paying debt payments for Lawrence and the High School.
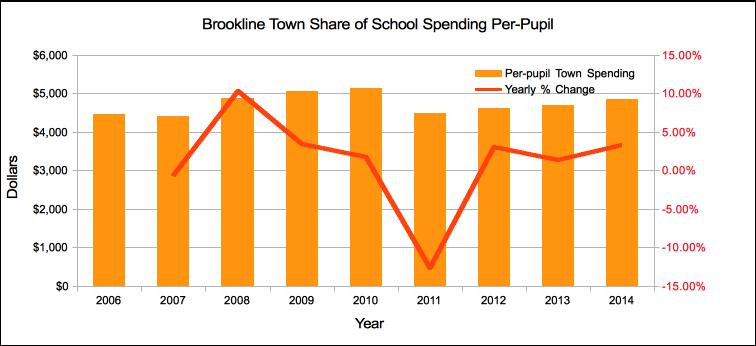
Brookline Town Share of School Spending Per-Pupil
Finally, what about the comment that per-pupil inflation adjusted spending has gone down? A quick detour to the Bureau of Labor Statistics for an inflation calculator and let’s run the per-pupil School Budget dollars through that to give us that:
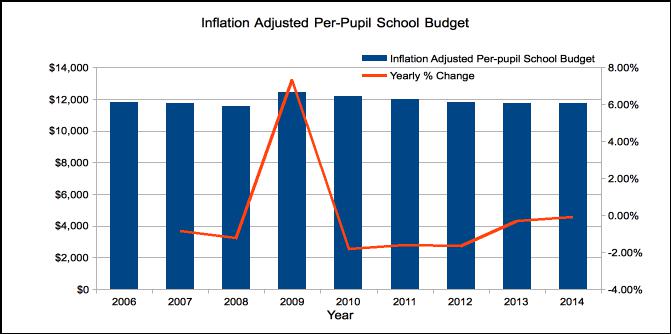
Per-pupil School Budget inflation adjusted
The large increase in all those School Budget numbers in 2009 is due to the 2008 Override. The negative year-over-year change in 2011 was due to the items we talked about above: retiring debt from New Lincoln School and also joining the GIC insurance.
Summary
Back to the question at the top – are we spending more or less on our kids? That’s kind of the wrong question. Are we spending more or less on the things that affect our kids education?
From 2006 to 2014, we had:
- A 21% increase in enrollment from 6014 to 7288 from Pre-K to 12th grade;
- A school budget increase of 41.8%.
- Yes, that includes a previous override. But that’s because we increased spending on schools.
- A 17% school budget increase per-pupil over that time.
- a hair below 0% change in per-pupil inflation adjusted change in the school budget since 2006.
Are our kids worse off because we we finished paying off debt and saved a bundle on health insurance? Absolutely not. If the metric you use for “average per-pupil spending” goes down when those two costs go down, then you’ve got a really stupid metric. And that, folks, is what the “average per pupil (including CIP)” metric is when justifying why the next override should be the Maximum Extent Override Possible (MEPO).
A “debt exclusion“, by definition, is a temporary (albeit long ~ 20 – 25 years) measure. It goes away when the project is paid off. But more importantly, there should be zero surprise factor that the debt is retiring. As in – you can forecast it and build a budget around it. Thanks New Lincoln School and High School renovation, we’re glad you’re off the books.
The Town stopped spending $5M dollars. Did we spend less on teachers? No. Did we have to let go of librarian assistants because of this “reduction”? No. Did we have to increase user fees in Town? No. Did we have to reduce services to kids because we were “spending less money” on debt service? No.
Table combining data from the Dept of Education site, the Brookline School Budget, and the Bureau of Labor statistics:
| Brookline School Spending By Year | |||||||||
| 2006 | 2007 | 2008 | 2009 | 2010 | 2011 | 2012 | 2013 | 2014 | |
| Enrollment Pre-K to 12 | 6014 | 6142 | 6168 | 6321 | 6472 | 6627 | 6875 | 7112 | 7288 |
| Yearly % Change | 2.13% | 0.42% | 2.48% | 2.39% | 2.39% | 3.74% | 3.45% | 2.47% | |
| School Department Budget | $60,414,544 | $62,916,637 | $64,786,212 | $70,987,572 | $72,515,419 | $75,346,929 | $78,443,875 | $82,086,987 | $85,643,933 |
| Yearly % Change | 4.14% | 2.97% | 9.57% | 2.15% | 3.90% | 4.11% | 4.64% | 4.33% | |
| Inflation Adjusted School Dept Budget | $71,152,170 | $72,046,830 | $71,445,050 | $78,562,930 | $78,958,860 | $79,531,010 | $81,121,270 | $83,663,190 | $85,643,933 |
| Yearly % Change | 1.26% | -0.84% | 9.96% | 0.50% | 0.72% | 2.00% | 3.13% | 2.37% | |
| Per-pupil School Budget | $10,046 | $10,244 | $10,504 | $11,230 | $11,204 | $11,370 | $11,410 | $11,542 | $11,751 |
| Yearly % Change | 1.97% | 2.54% | 6.92% | -0.23% | 1.47% | 0.35% | 1.16% | 1.81% | |
| Inflation Adjusted Per-pupil School Budget | $11,831 | $11,730 | $11,583 | $12,429 | $12,200 | $12,001 | $11,799 | $11,764 | $11,751 |
| Yearly % Change | -0.85% | -1.25% | 7.30% | -1.84% | -1.63% | -1.68% | -0.30% | -0.10% | |
| Town Spending on Behalf of Schools | $26,824,273 | $27,188,868 | $30,136,626 | $31,937,918 | $33,264,116 | $29,765,693 | $31,829,842 | $33,362,664 | $35,306,932 |
| Yearly % Change | 1.36% | 10.84% | 5.98% | 4.15% | -10.52% | 6.93% | 4.82% | 5.83% | |
| Per-pupil Town Spending | $4,460.30 | $4,426.71 | $4,885.96 | $5,052.67 | $5,139.70 | $4,491.58 | $4,629.80 | $4,691.04 | $4,844.53 |
| Yearly % Change | -0.75% | 10.37% | 3.41% | 1.72% | -12.61% | 3.08% | 1.32% | 3.27% | |
* MEPO = “Maximum Extent Possible Override” , an homage to the BSPACE report findings that several expansions should be done to the “maximum extent possible”.